Reimagine growth at Elevate – Dallas 2025. See the Agenda.
Who We Serve
We strengthen bold leaders – from the world’s largest companies to ambitious disruptors – helping them outpace the competition and shape the future.
What We Offer
Our memberships, custom support, and in-depth published research equip you with the reliable information you need to make data-led decisions with measurable success.
Our Expertise
We blend deep industry expertise with leading-edge research driving growth, innovation, and resilience. With Everest Group, data meets strategy, and vision turns into measurable impact.
Insights
Our wealth of resources inspires ideas and new ways of thinking with real-world solutions and the latest trends that drive your business forward.
Company
We’re committed to helping you get it right. Through trusted expertise, rigorous research, and practical insights, we enable businesses to make confident decisions.
Filter
Displaying 1-10 of 12
Can Indian Tier-2/3 Cities Fit the Bill for Digital Services Delivery? | Sherpas in Blue Shirts
The second league rules in BPO | In the News
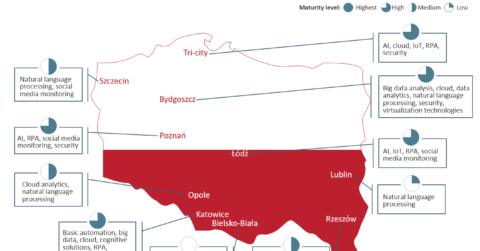
Poland’s smaller cities get into the Digital Delivery Mix | Market Insights™
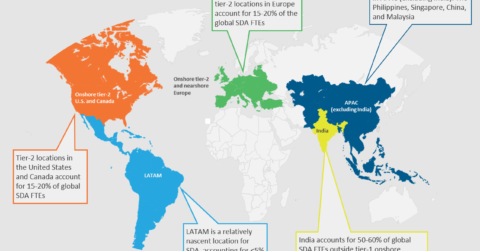
Service Delivery Automation (SDA) Services Global Sourcing Landscape | Market Insights™
Onshoring, Talent Development, Automation – My Top 10 Picks from RevAmerica 2015 | Sherpas in Blue Shirts
John Mellencamp Named Honorary Everest Group Analyst of the Month | Sherpas in Blue Shirts
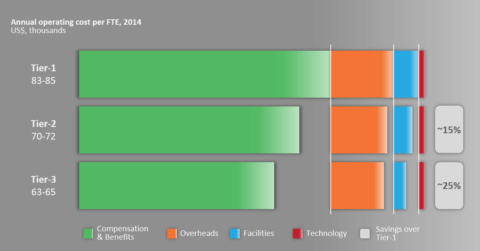
US Onshore Delivery: Tier-2/3 Cities Offer Significant Savings | Market Insights™
Tier-2/3 Cities’ Growing Attractiveness as Promising Locations to Deliver Global Services – Can Runners Up Be Winners as Well? | Sherpas in Blue Shirts
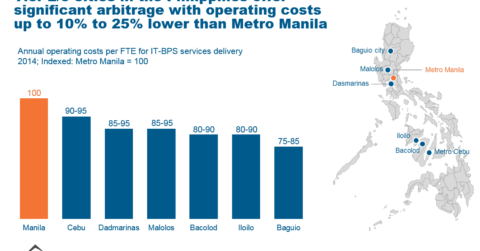
Tier-2/3 Cities in the Philippines Offer Significant Arbitrage | Market Insights™
Slow Growth of GICs… Is the Model Losing Its Sheen? | Sherpas in Blue Shirts