Reimagine growth at Elevate – Dallas 2025. See the Agenda.
Who We Serve
We strengthen bold leaders – from the world’s largest companies to ambitious disruptors – helping them outpace the competition and shape the future.
What We Offer
Our memberships, custom support, and in-depth published research equip you with the reliable information you need to make data-led decisions with measurable success.
Our Expertise
We blend deep industry expertise with leading-edge research driving growth, innovation, and resilience. With Everest Group, data meets strategy, and vision turns into measurable impact.
Insights
Our wealth of resources inspires ideas and new ways of thinking with real-world solutions and the latest trends that drive your business forward.
Company
We’re committed to helping you get it right. Through trusted expertise, rigorous research, and practical insights, we enable businesses to make confident decisions.
Filter
Displaying 1-7 of 7
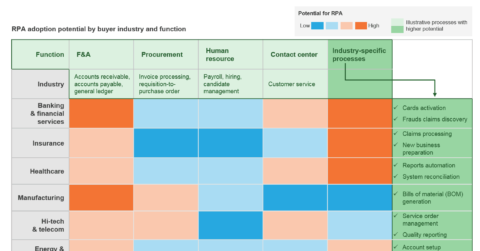
The Robotic Process Automation (RPA) Opportunity Varies by Industry and Function | Market Insights™
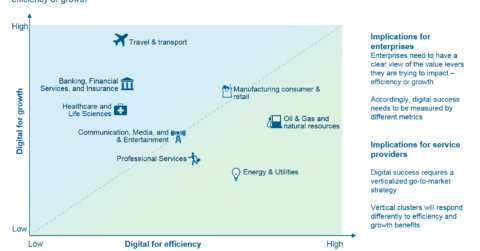
Digital Investment Imperatives: Efficiency or Growth? | Market Insights™
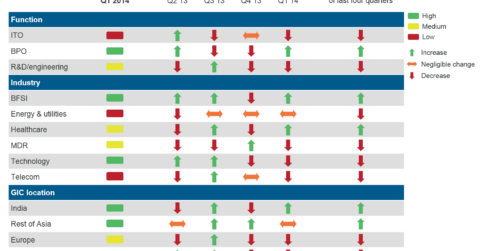
GIC Market Trends Q1 2014 | Market Insights™
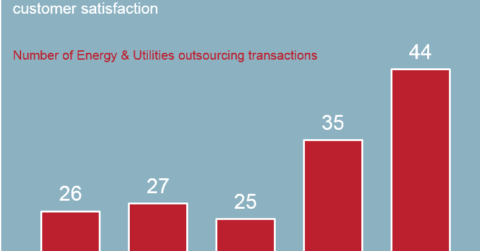
Energy & Utilities (E&U) Outsourcing Transactions Hit a Record High | Market Insights™
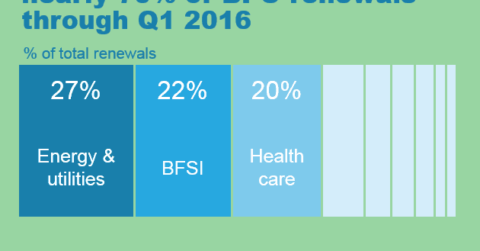
Three Industries Account for ~70% of BPO Renewals Through Q1 2016 | Market Insights™
The Evolution to Next Generation Operating Models in the Energy Industry | Sherpas in Blue Shirts
Size Does Matter – The Real Pecking Order of Indian IT Service Providers | Sherpas in Blue Shirts