Reimagine growth at Elevate – Dallas 2025. See the Agenda.
Who We Serve
We strengthen bold leaders – from the world’s largest companies to ambitious disruptors – helping them outpace the competition and shape the future.
What We Offer
Our memberships, custom support, and in-depth published research equip you with the reliable information you need to make data-led decisions with measurable success.
Our Expertise
We blend deep industry expertise with leading-edge research driving growth, innovation, and resilience. With Everest Group, data meets strategy, and vision turns into measurable impact.
Insights
Our wealth of resources inspires ideas and new ways of thinking with real-world solutions and the latest trends that drive your business forward.
Company
We’re committed to helping you get it right. Through trusted expertise, rigorous research, and practical insights, we enable businesses to make confident decisions.
Filter
Displaying 1-8 of 8
Are the Automation Savings Numbers You Hear Real? | Blog
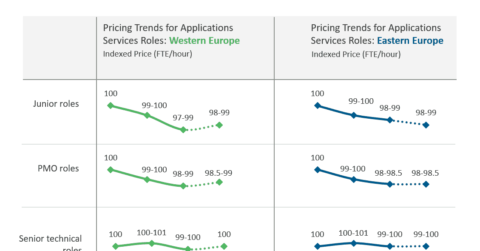
Brexit’s Impact on FTE Pricing | Market Insights™
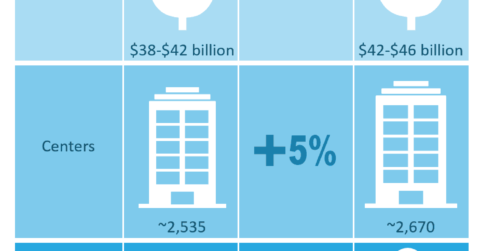
The GIC Market Landscape | Market Insights™
Surge in Onshoring Shapes Global Sourcing Market | Press Release
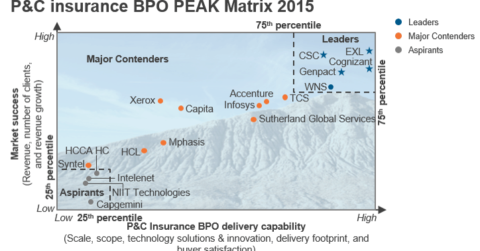
Property and Casualty Insurance BPO – Service Provider Landscape with PEAK Matrix™ Assessment 2016 | Market Insights™
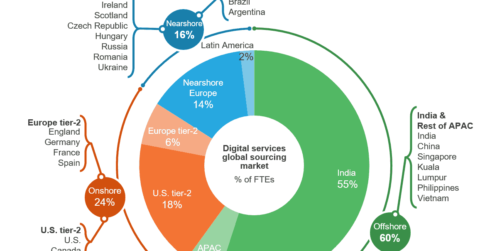
Everest Group Identifies Digital Sourcing Hot Spots | Press Release
Life and Pensions Insurance BPO – Service Provider Landscape with PEAK Matrix™ Assessment 2015 | Market Insights™
Are You Paying too Much for Outsourced Resources? | Sherpas in Blue Shirts