Who We Serve
We strengthen bold leaders – from the world’s largest companies to ambitious disruptors – helping them outpace the competition and shape the future.
What We Offer
Our memberships, custom support, and in-depth published research equip you with the reliable information you need to make data-led decisions with measurable success.
Our Expertise
We blend deep industry expertise with leading-edge research driving growth, innovation, and resilience. With Everest Group, data meets strategy, and vision turns into measurable impact.
Insights
Our wealth of resources inspires ideas and new ways of thinking with real-world solutions and the latest trends that drive your business forward.
Company
We’re committed to helping you get it right. Through trusted expertise, rigorous research, and practical insights, we enable businesses to make confident decisions.
Filter
Displaying 21-27 of 27
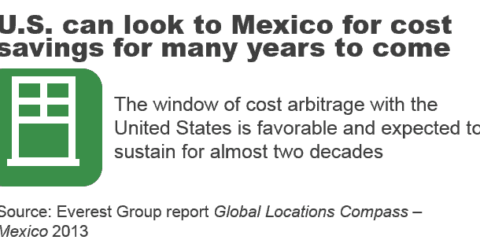
U.S.-to-Mexico Cost Arbitrage Favorable into the Future | Market Insights™
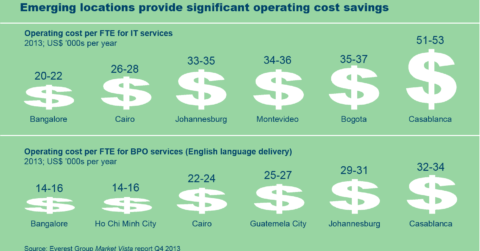
Emerging Locations Provide Real Operating Cost Savings | Market Insights™
The Curious Case of Currency Trends and Cost Competitiveness | Sherpas in Blue Shirts
What Global Services Can Learn from the NFL Salary Cap | Sherpas in Blue Shirts
Post Captive Global In-house Center Webinar Musings: Change is Not as Hard or as Quick as You Might Think | Sherpas in Blue Shirts
Is 10% Salary Inflation Too High? A Perspective on the Offshore Wage Increases | Sherpas in Blue Shirts
Do Indian Tier 1 Service Providers Run the Risk of Losing Their Cost Competitiveness? | Sherpas in Blue Shirts