Reimagine growth at Elevate – Dallas 2025. See the Agenda.
Who We Serve
We strengthen bold leaders – from the world’s largest companies to ambitious disruptors – helping them outpace the competition and shape the future.
What We Offer
Our memberships, custom support, and in-depth published research equip you with the reliable information you need to make data-led decisions with measurable success.
Our Expertise
We blend deep industry expertise with leading-edge research driving growth, innovation, and resilience. With Everest Group, data meets strategy, and vision turns into measurable impact.
Insights
Our wealth of resources inspires ideas and new ways of thinking with real-world solutions and the latest trends that drive your business forward.
Company
We’re committed to helping you get it right. Through trusted expertise, rigorous research, and practical insights, we enable businesses to make confident decisions.
Filter
Displaying 71-80 of 107
The Son-in-Law | Sherpas in Blue Shirts
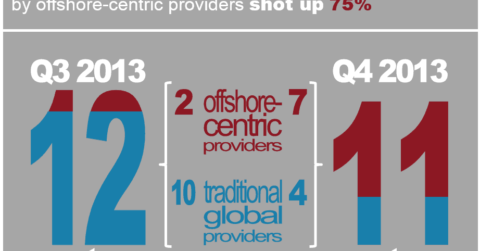
New Provider Locations: Up AND Down in Late 2013 | Market Insights™
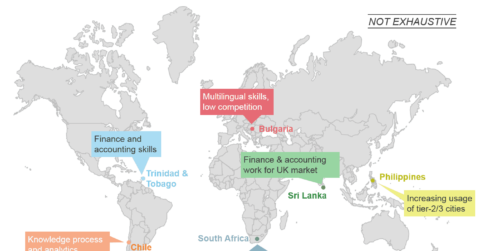
Companies Will Continue to Explore “Newer” Frontiers for Service Center Placement | Market Insights™
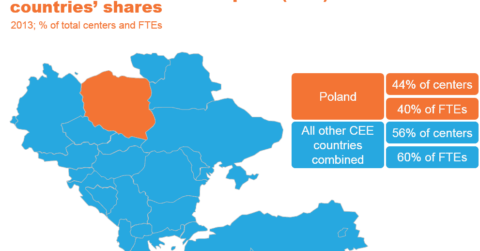
Poland’s Global Sourcing Share Dwarfs Other CEE Countries | Market Insights™
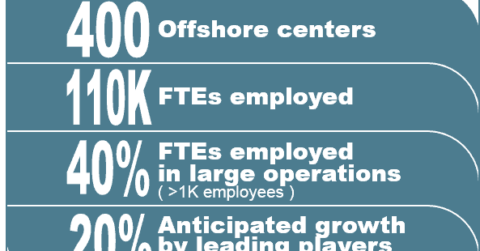
Poland Offshore Service Center Landscape | Market Insights™
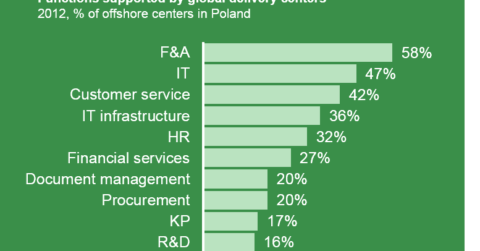
Poland’s Offshore Service Centers Offer Endless Options | Market Insights™
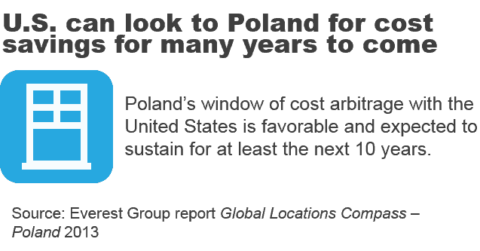
Poland’s Long-Term Cost Arbitrage Opportunity | Market Insights™
Poland Global Delivery Centers Employment CAGR~18% | Market Insights™
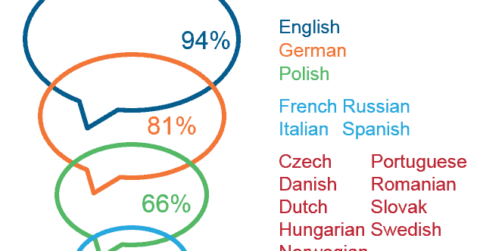
Poland Leading Destination for Multi-Lingual Talent | Market Insights™
The Three Foundational Elements of Cost Benchmarking | Sherpas in Blue Shirts