Tag: onshore

John Mellencamp Named Honorary Everest Group Analyst of the Month | Sherpas in Blue Shirts

“Well I was born in a small town
And I live in a small town
Prob’ly die in a small town
Oh, those small communities

All my friends are so small town
My parents live in the same small town
My job is so small town
Provides little opportunity

— John Mellencamp, Small Town (1985)

Turns out Mr. Mellencamp was a pretty good analyst when it comes to assessing global services employment opportunities in small communities. So much so, that I am officially naming him as “Honorary Everest Group Analyst of the Month.”

No, I am not smoking something.

We just completed a first of its kind analysis of the U.S. Domestic Outsourcing location landscape for RevAmerica and finally have the key facts the industry has been lacking. In short, although smaller communities are sometimes used for service delivery, the reality is that the vast majority of the market is concentrated in larger communities with populations measured in the 100,000s vs. 10,000s. In particular, tier-3 cities are the sweet spot…the largest number of centers, the largest employment, and the largest centers.

Defining the city tiers

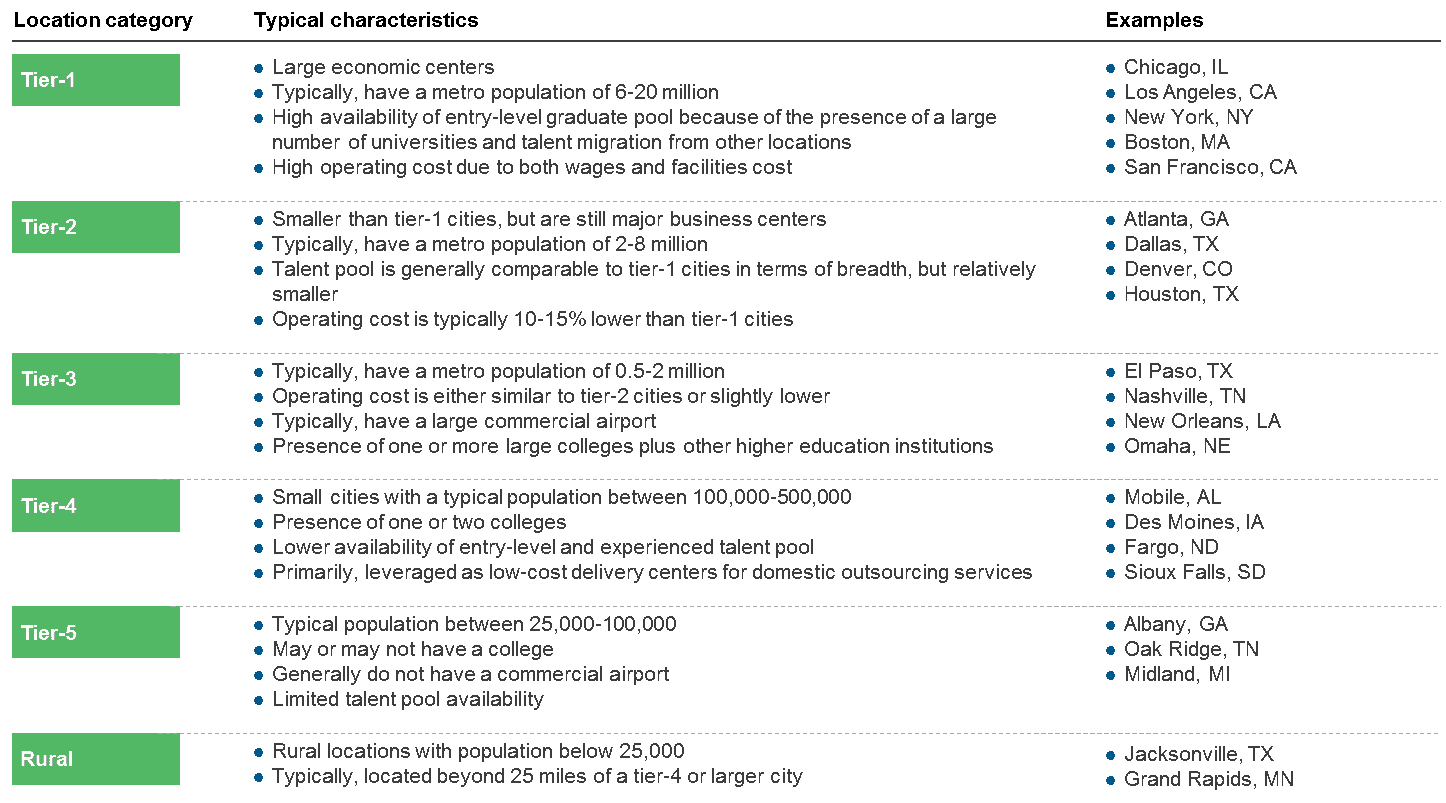
In order to analyze approximately 250 metro cities, we segmented them into six groups – tier-1 through tier-5 plus rural. As indicated below, the city segments are characterized by differences in population size plus commercial and educational factors.

Location Definitions

Although only one dimension of a city’s potential for service delivery, it is easy and revealing to look at the differences in average population size of the city tiers. Each city tier is 20-40% of the population of the next larger city tier, which leads to a dramatic difference in the profile of cities that are 2-3 tiers different from each other.

Population of city tiers

It’s good to be a tier-3 city!

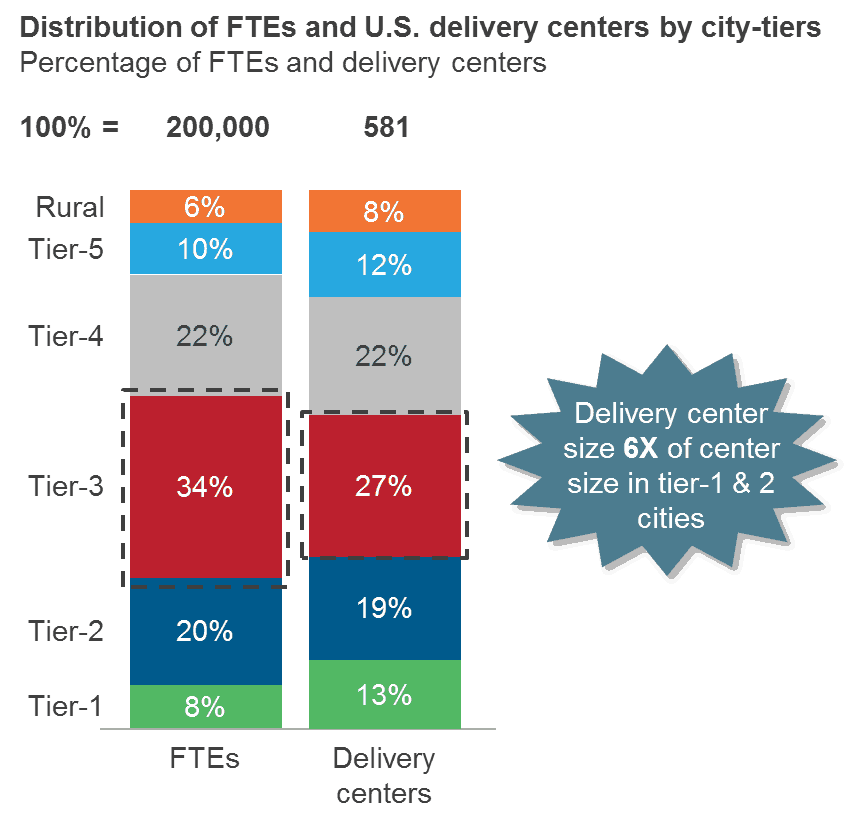
One of the most interesting findings from the research was the extent to which tier-3 cities dominate on almost every dimension. As shown in the exhibit below, they have the largest share of FTEs and delivery centers of all cities. Further, their centers are on average larger than any other city tier.

Distribution of FTEs and US delivery centers by city-tiers

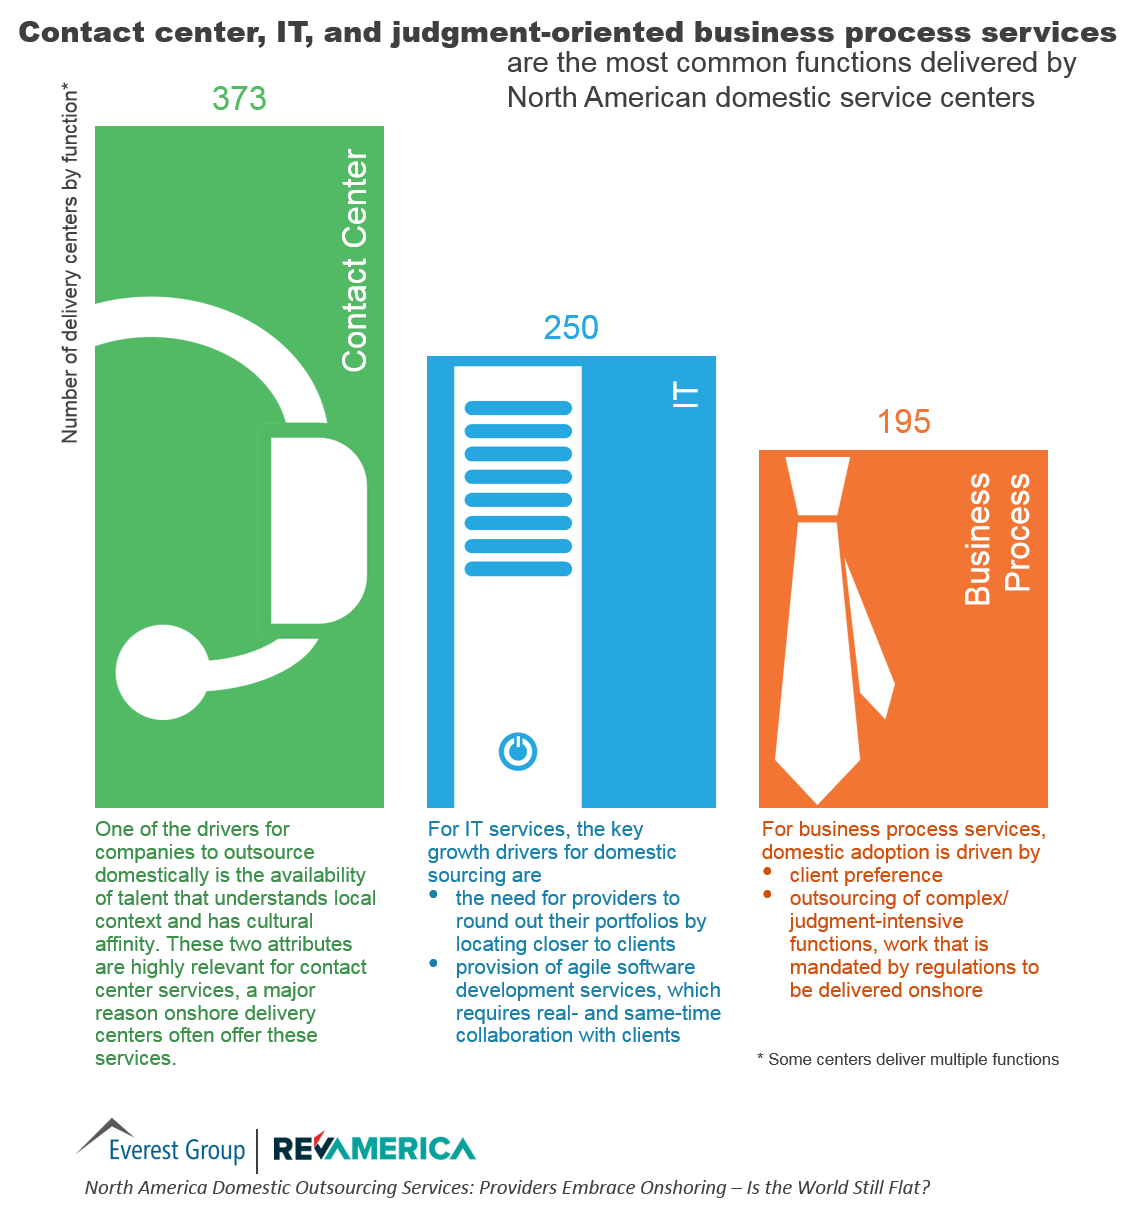
Additionally, tier-3 cities have the largest portion of multi-function centers (some combination of IT, business process, and contact center) and are the centers which are expected to grow the most in coming years.

Given that tier-3 cities average one million in population, most are surprised that cities of this size are driving the growth of domestic outsourcing delivery – many would expect smaller cities to be the primary forces. So why are tier-3 cities favored?

In short, we believe this is due to three factors which work in combination with each other:

  • Sufficient cost savings: Relative to tier-1 cities, tier-3 cities offer 15-20% savings; moving to tier-4 cities may only offer 5% more savings and in many cases is either cost neutral or even higher cost than a tier-3 city.
  • Enough talent: With nearly one million in population, the installed base of experienced talent is sizeable. Further, most tier-3 cities have large colleges which produce fresh talent for the entry labor force. Combined with the life style benefits of a larger city (airport, entertainment, shopping, etc.), tier-3 cities have the ability to both keep talent and to attract talent from other cities – either smaller or larger cities. Not everyone would want to live in New York, NY; similarly, many people could not imagine living in a town of Midland, MI (a town of roughly 50,000). However, many people could be comfortable in a city of one million.
  • Accessible: Although the idea of a remote, small city may seem attractive in order to capture an isolated labor pool, this doesn’t hold up well when assessed in detail. First, even small communities have competition for talent plus limited talent pools – costs can quickly spiral up. Second, the practical logistics of transit to these small cities creates an inconvenience that most organizations wish to avoid (especially for IT service delivery, requiring more cross-center collaboration). Most tier-3 cities are connected by direct flights to other major business centers within two to three hours of flight time.

In other words, tier-3 cities have an attractive mix of cost savings and talent, while still being comparatively easy from an operational perspective. This is broadly true, but less true for pure contact center work which can more easily operate at scale in tier-4 cities and even some tier-5 cities due to the broad labor pool which can fill contact center roles.

So, would Mr. Mellencamp’s small town have been a viable service delivery location? He is from Seymour, Indiana, with a population of about 16,000 – clearly a rural community by our definition. Highly unlikely many organizations could operate an IT or business process center of 200 FTEs in Seymour, although a smaller contact center could be viable. So, yes, there might be jobs…but little opportunity…

Also check out my co-presenter Sakshi Garg’s top 10 takeways from RevAmerica.


Photo credit: Flickr
Automation Feeds Desire for Onshore Services | Sherpas in Blue Shirts

There’s a lot of rethinking going on in North American businesses in light of new technologies. In Everest Group’s conversations with clients and in round table discussions we’ve been holding in the industry, we find that these mature companies believe automation gives them the ability to bring their work back on shore.

After more than a decade of achieving value through the offshore labor arbitrage model, one would think that mature organizations that have built GICs or captives, or organizations with extensive use of third-party outsourcing providers, would be at peace with the model. We expected them to move to a model of arbitrage plus automation. But the level of peace and comfort with offshore arbitrage is much less than we expected, and companies are expressing their desire to use robotics automation to repatriate their work.

This is particularly the case in regulated industries with significant compliance requirements. This is where the desire to move work back on shore shows up first. The increasingly regulated financial services industry is especially burdened with complex regulations. These businesses receive a higher degree of scrutiny if operations are in offshore low-cost locations than if they are automated. It’s easier to demonstrate compliance in an automated environment than in an arbitrage labor environment.

Moreover, these companies believe life is easier in an onshore environment than in an offshore environment.

This is not to say the desire to move work back on shore is a sea change. But we are seeing the early stages of this movement.

I think this is a very interesting development. Our hitherto assumption that the market had overcome its xenophobic fears is not correct. It’s quite possible that the steady blast of negative press in the media and the nationalistic pressure from consumers may be starting to play a role in this re-examination.


Photo credit: Flickr

80/20 Stands on Its Head in the Services Industry | Sherpas in Blue Shirts

The mantra of 80/20 (80 percent offshore, 20 percent onshore) has been the war cry for the services industry for the last 10 years. It has stood for the absolute sweet spot for a services player, particularly in terms of maximum leverage of offshore talent. This has been the most profitable space. Providers that approached this sweet spot have been the fastest growing and most profitable players.

It has been a thing of beauty and a joy forever … well, not really forever. Things change.

What we’re seeing in a segment of the industry is that customers now ask for 80/20 in the opposite way – 80 percent onshore and 20 percent offshore. They’re not asking for their entire delivery platform to do this. But in discrete segments they are looking for a much more intimate onshore model – more industry domain knowledge, more company knowledge and the provider’s teams stood up next to their teams or intermingled with their teams where they can drive to functionality very fast. They also want less churn.

To be clear, it’s not happening everywhere. But the desire to move to this alternative 80/20 model is happening in some of the fastest-growing and most lucrative segments of the industry. For instance, we see this model approaching in digital. We hear customers voice this aspiration in healthcare. And we talk with many large, sophisticated clients that express the desire to change the model.

They’re not looking to lose labor arbitrage completely, but they want to turn the 80/20 model on its head. And they are willing to give up some of the cost benefits of the old factory model for the speed, intimacy, and agility of the new model.


Photo credit: Flickr

U.S. Domestic Sourcing: Early Insights from Research for RevAmerica Event | Sherpas in Blue Shirts

Three stoplights. Well, eventually four by the time I moved away in 1985. Also, a line of people each night around the new McDonalds for several days after it opened in the late 1970s.  This was the situation in my hometown of Maryville, Missouri with a population of just less than 10,000 people at the time.

Small, rural town, right? Yes, it was in many ways. But it was also home to a university, Northwest Missouri State University, which was the first college in the U.S. to put PCs into every dorm room and a student population of about 5,000. The area was packed with PhDs and farmers quietly living the pleasant life in the middle of the country.

As the buzz about rural and domestic outsourcing has increased over the past five years, I have often wondered “Is this type of location a good candidate for a service delivery center?” To the best of my knowledge, it does not have a service delivery center of any notable scale.

To help answer questions like these, Everest Group is the research partner for RevAmerica, to be held in New Orleans on May 5-7, 2015. This is the only event focused on domestic sourcing in the U.S. and Canada.

The research report that we release at the event will analyze the trends in domestic outsourcing, looking at variations by location type across different functions (IT, business process, contact center), type of service provider, and other factors.

Although we are currently deep in the middle of collecting responses to RFIs and conducting interviews, we have been able to glean a few initial insights from the database of approximately 350 cities, which range from small, rural communities to tier 1 cities. Some of these insights include:

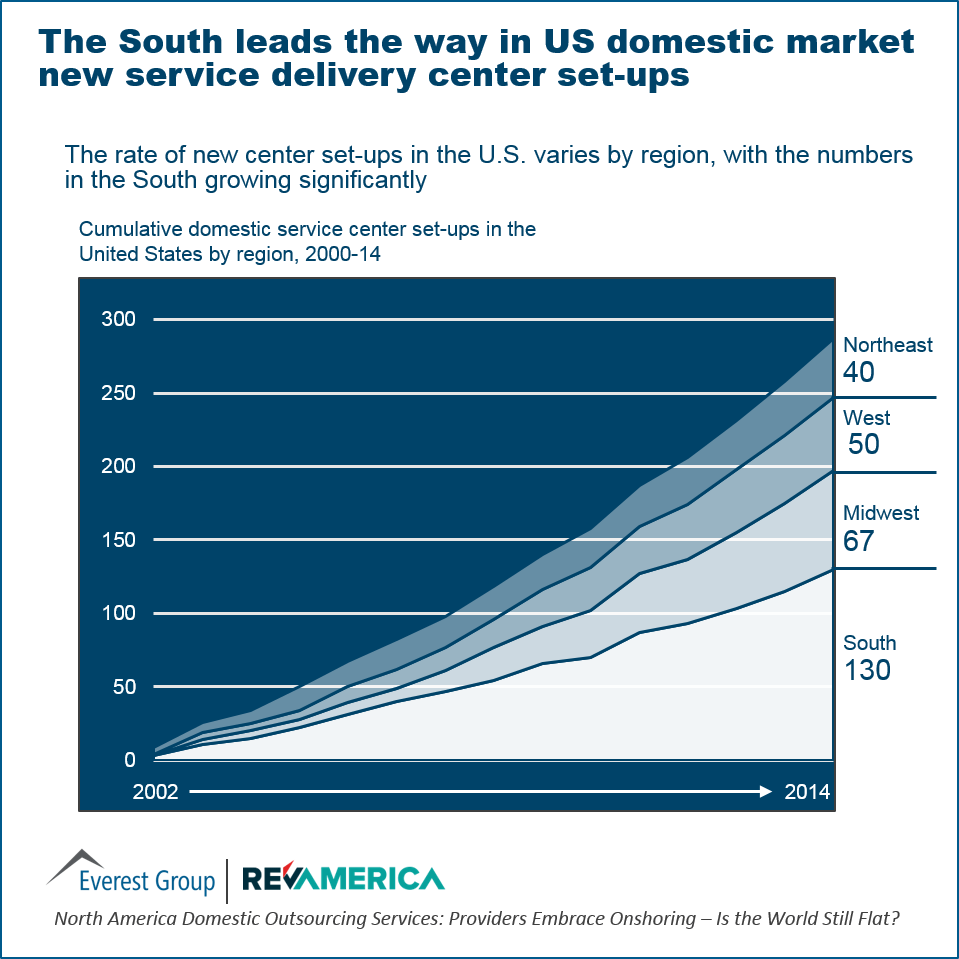
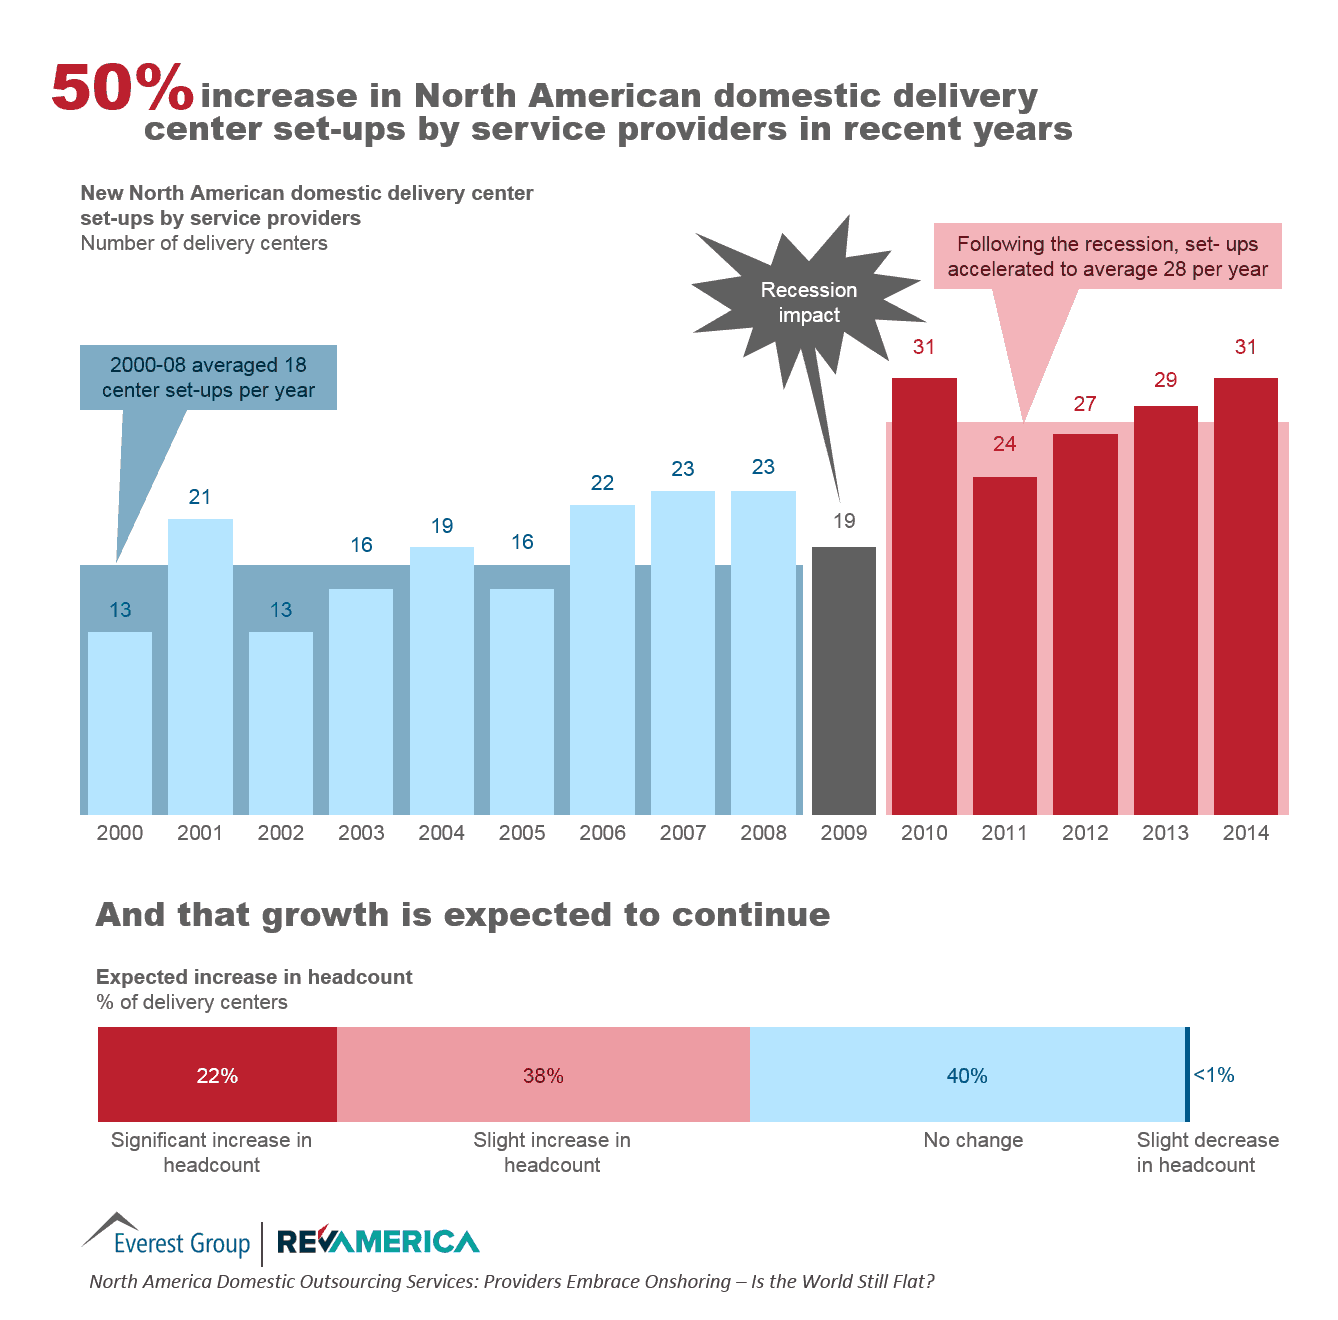
  • The number of centers for domestic outsourcing is clearly on a growth trajectory and with a whopping 66% centers expecting headcount growth in next 3 years
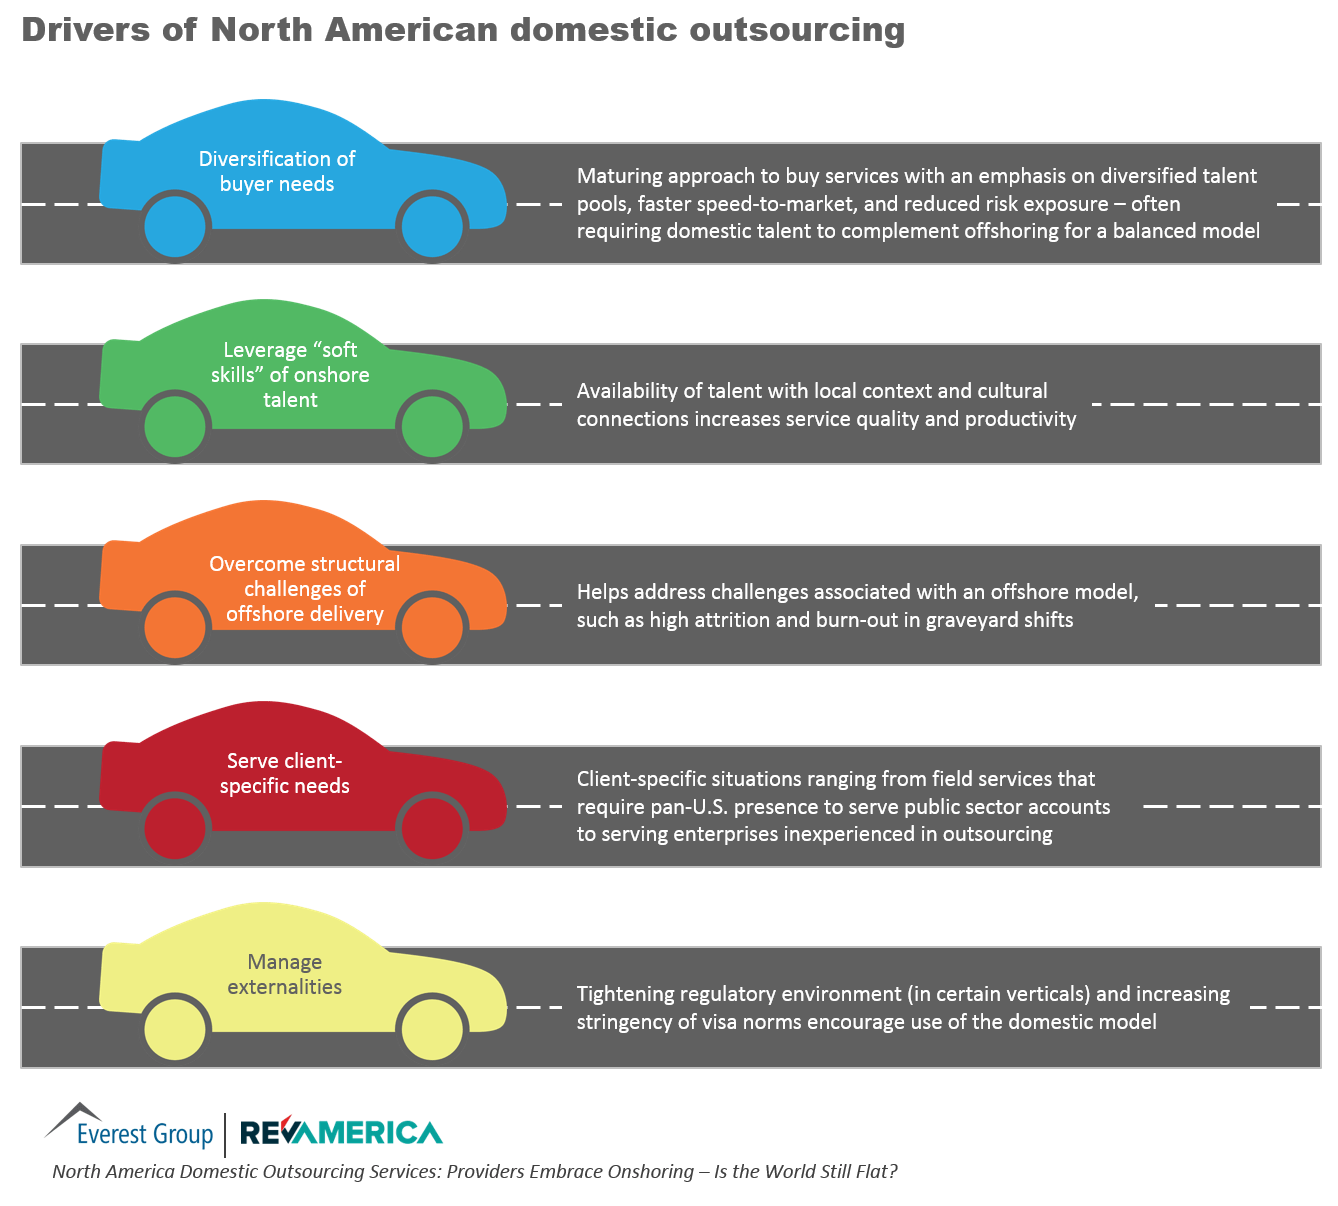
  • Some of this is in response to preferring domestic locations over offshore locations, but much is about creating a portfolio of locations to support increasingly diverse sets of work
  • The typical size of a center is in the range of 100-500 employees; some centers are in the 1,000 employee range and are almost exclusively a long-term hub of an organization in a tier 2 location (vs. tier 3 or 4 or rural)
  • For IT services, the key driver is largely around the presence of local educational institutions that offer computer science and technical training, and are willing to collaborate on helping shape that talent for the needs of technical employers. Having said that, IT is a function where more than half of the centers are using a mix of locally hired resources and landed resources (resources traveling from other parts of the world on work permit)
  • Finally, two-thirds of the centers are single function delivery focused (i.e., IT or BP or CC) and couple with the fact that they are small, indicates that they have been primarily set-up to serve a specific need – serve a local client, tap into (small) specific talent pool at the same time gain cost arbitrage

We invite you to join us in New Orleans as we roll out the findings of this important study. We look forward to hearing your experiences.

How can we engage?

Please let us know how we can help you on your journey.

Contact Us

"*" indicates required fields

Please review our Privacy Notice and check the box below to consent to the use of Personal Data that you provide.