Category: Benchmarking

Nine Tactics that Can Improve Salesforce Contract Negotiation | Blog

Getting the best deal on Salesforce CRM software can be tricky. Most enterprises find contract benchmarking challenging because market data and custom discounting on modules are unclear. Learn nine key approaches and valuable market insights from our Salesforce contract negotiation playbook that can be used in purchasing or renewal discussions. 

When negotiating, understand that software and services are quite different businesses. Over our 25-plus years of services experience, we have observed large pricing variations for services due to client-specific factors such as lead time to renewal, industry, enterprise business size, etc. The software business also has the additional complexity of product stickiness compared to services.

Enterprises should be mindful that, like any software provider, Salesforce also wants to increase its overall revenue per customer each year and is always actively looking for opportunities to increase user volume, expand product adoption rates, and upsell higher versions by offering value adds and new modules at discounted rates.

To get optimal pricing, especially with a looming recession, enterprises should be aware of the various Salesforce contract negotiation tactics that they can leverage for new contracts as well as renewals.

Based on our experience assessing Salesforce contracts for customers of varying revenues and domains, we have found the following nine steps that can give enterprises an edge:

  1. Assess current and future demand: Enterprises should thoroughly assess their current Salesforce usage and environment. Having a granular understanding of the utilization of individual modules and add-on needs can prevent the enterprise from buying more expensive and premium editions. While customers have seen better Salesforce discounts for more expensive editions, enterprises should always purchase the most suitable versions for their end users (super or light users) to alleviate concerns about software usage
  2. Examine new products or potential alternatives: When performing demand management, enterprises also should look at cost-effective, viable alternatives from competing vendors. Even if similar options do not exist for each module, demonstrating awareness of alternatives can initiate effective discussions during Salesforce contract negotiations
  3. Perform an enterprise-level portfolio assessment: Different business units often get varied pricing (even if marginal) for individual modules since they have either different sales reps or the products were added to the Salesforce portfolio through acquisitions. We recommend enterprises build an extensive roadmap of future requirements that consolidates and forecasts volumes across business Larger deals with greater volume are more likely to get higher discounts versus multiple smaller deals with low volume. Also, signing longer contract terms can be an effective measure to get better discounts in Salesforce contract negotiations
  4. Evaluate the contract’s market competitiveness: We have observed that Salesforce product pricing varies significantly across enterprises based on deal size, industry, strategic relationship, client logo, contract tenure, etc. We highly recommend enterprises perform external contract benchmarking of their existing agreement before entering the negotiation process. This provides more transparency on the deal’s competitiveness and also makes Salesforce more open to discussions about the overall commercial structure, including unified price protection, upfront and volume-based discounting, etc. We see enterprises receive competitive pricing and higher discounts for additional modules or for products where Salesforce is expanding into new areas. For example, organizations that previously used Sales and Service Cloud may get better discounting for the marketing modules as Salesforce views this as an investment to get entrenched into the enterprise’s overall value chain
  5. Align negotiations with Salesforce’s fiscal end of quarter/year: Many enterprises already know that Salesforce’s fiscal year concludes later or earlier than the typical calendar/fiscal year of its clients. To ensure predictable revenues, Salesforce account executives may want to quickly close negotiations by offering a few additional single-digit percentage point discounts during this period
  6. Understand the account executive’s role in discounting: Salesforce has a multi-tiered discounting structure. This implies that each management level has the authority to approve specific incremental discounts. While the deal desk decides the discounts, enterprises must clearly communicate expectations (including asking for cash preservation for future years) with the account executive, who can further send the correct messages to the next approval level
  7. Take advantage of service credits: Much like other software providers, Salesforce or its resellers may offer customers certain resources as an investment to support them during the platform implementation. Service credit provides an effective way to have hand-holding during the actual implementation
  8. Secure upfront price protection: At the start of the relationship, an enterprise has the most leverage. With new contracts, enterprises should sign upfront price protection clauses to prevent price increases for at least two to three years. When renewing, longer-term contracts instead of yearly renewals can help protect prices
  9. Sign global contracts: Enterprises also should ask Salesforce for global contracts that not only consolidate the business units or geographies but also acquire products such as Tableau, Mulesoft, Slack, etc. Discounts are often lower for these products because each unit has its own sales representatives and enterprises spend less on these platforms. Enterprises should request one single point of contact for negotiating the entire portfolio

While each relationship with Salesforce is unique, we firmly believe these recommendations can put your enterprise in a better negotiating position. To discuss Salesforce contract negotiation and for a detailed analysis, please reach out to [email protected]. Explore more about Everest Group’s contract benchmarking offerings.

Don’t miss our session, Nordea’s Story: IT Vendor Management Transformation, to hear from Mihaela Tapu, Head of Supplier Performance Management at Nordea, and how Nordea transformed its IT vendor management function to overcome key obstacles related to compliance, service level management, financial planning, and control.
Output-based Pricing Gaining Ground in Application Services Outsourcing | Blog

Over the past several years, output-based pricing has increased in popularity in infrastructure services and transactional business process outsourcing deals. More recently, enterprises have warmed up to the idea of using this pricing model for application services.

This should come as no surprise, given the benefits. Here’s an example that paints a clear picture of the advantages of output-based pricing in application services.

One of our clients – a large retail firm – was using the managed capacity pricing model. While in isolation the pricing appeared attractive, the firm wasn’t able to differentiate the fee it was paying for critical versus non-critical applications. The fee it was paying was a black box with no foreseeable value. After a thorough analysis of its portfolio, we realized that there were instances of over-utilization, redundant budgeting, and unnecessary allocation of resources for certain applications.

After we armed the company with market best practices data on business criticality, support coverage, ticket volumes, ticket type, usage, change frequency, and underlying technology, it renegotiated its contract with its provider. The new contract is saving the retailer 15 percent compared to earlier spend. And the adoption of the output-based pricing model spurred conversations around portfolio transformation, particularly in the cloud.

Overall, output-based pricing brings a lot of transparency into the pricing equation, and makes underlying delivery nuances clear. Enterprises’ procurement teams also find this pricing model attractive, as they can expect greater delivery certainty, better transparency, and more flexibility from the suppliers, leading to higher value relationships.

Output-based pricing is good for providers too

Service providers also benefit from this pricing model, as it allows them to charge a higher price per service unit delivered. Because the focus in this pricing construct is on services offered, not on the underlying number of resources, providers can cross-utilize resources across projects or charge a premium fee resulting in improved project margins.

Key success factors

Output-based pricing works best in scenarios where transaction volumes are known, repetitive, and predictable. Enterprises with clearly defined parameters such as industrialized estimation models to measure resource productivity can derive optimum results from this model.

However, the model may pose limitations in situations wherein the organization’s processes are not standardized. Engagements involving activities with a higher degree of subjectivity should not go for this pricing construct. And because procurement and delivery teams need a certain level of maturity in order to leverage the model effectively, it shouldn’t be used when the enterprise is new to outsourcing.

In order to succeed with output-based pricing, the client and the provider must collaborate, and both parties must remove as many constraints as possible to allow the provider to go about the best ways to achieve optimal results.

The onus is on the enterprise to provide access to historical data, information around regulatory requirements, business fluctuations, and identify clear risk areas. The service provider is responsible for being transparent on its assumptions, inclusions, exclusions, and risk premium.

Careful contract management right from the pre-contract phase is a prerequisite to make this pricing model work. Unambiguous definitions of performance measurements will help deliver the most favorable outcomes. Finally, there must be an open and trusting relationship between the two parties. Relationships that are based on up-ending each other will likely result in failure.

To learn more, please replay our recent webinar called Output-Based Pricing in Application Services: Adoption in the As-a-Service Economy, or contact our pricing experts directly at [email protected] or [email protected].

Middle East and Africa: An Emerging Frontier for Global Services | Blog

Numerous locations in the Middle East and Africa (MEA) are emerging as upcoming destinations for global services delivery. Several multinational companies have set up their centers in the MEA region to deliver services to Europe and North America, and tech giants including Apple, Facebook, Google, Microsoft, and Uber are leveraging it for global services delivery.

What’s the appeal?

Availability and quality of talent pool

There’s been a consistent increase in the pool of entry-level talent and experienced professionals with domain-specific skills. Egypt is the leader in the region; due to various government measures to improve education quality and a significant rise in contact center operations in multiple languages, including English, French, and Arabic, the country posted an enormous 35 percent increase in the headcount for global services exports in 2018.

There’s also been a considerable rise in R&D centers and Centers of Excellence (COEs), where talented professionals with relevant and often advanced technological skill sets work to develop state-of-the-art solutions.

Less competition for talent

Because there’s a relatively large population base, limited jobs, and high unemployment rates throughout much of the region – for example, South Africa is at 27 percent and Nigeria is at 23 percent – organizations can procure talent easily and train the workers as per their specific business needs.

Cost arbitrage

Some of the countries in the MEA region offer highly attractive cost arbitrage compared to source geographies. For example, Egypt, Nigeria, and Kenya come in at 70-80 percent less (although Nigeria and Kenya are primarily leveraged to serve domestic markets), and South Africa (for non-voice F&A) and Morocco (for voice-based services) offer cost savings of 40-60 percent over source geographies.

Proximity to Europe

Proximity with various European countries is a big selling point of many African locations. For example, because Morocco offers both cultural and geographical proximity to France and Spain, companies are increasingly leveraging it for French and Spanish voice-based business process services. Because the English language was introduced by British colonists, and because there’s shared cultural affinity, South Africa is becoming a popular destination for voice-based services delivery for U.K. companies. Additionally, because most African countries share similar time zones with Europe, delivery and client teams are able to collaborate in real time, thereby, optimizing work in both the geographies.

The leading locations in the MEA region

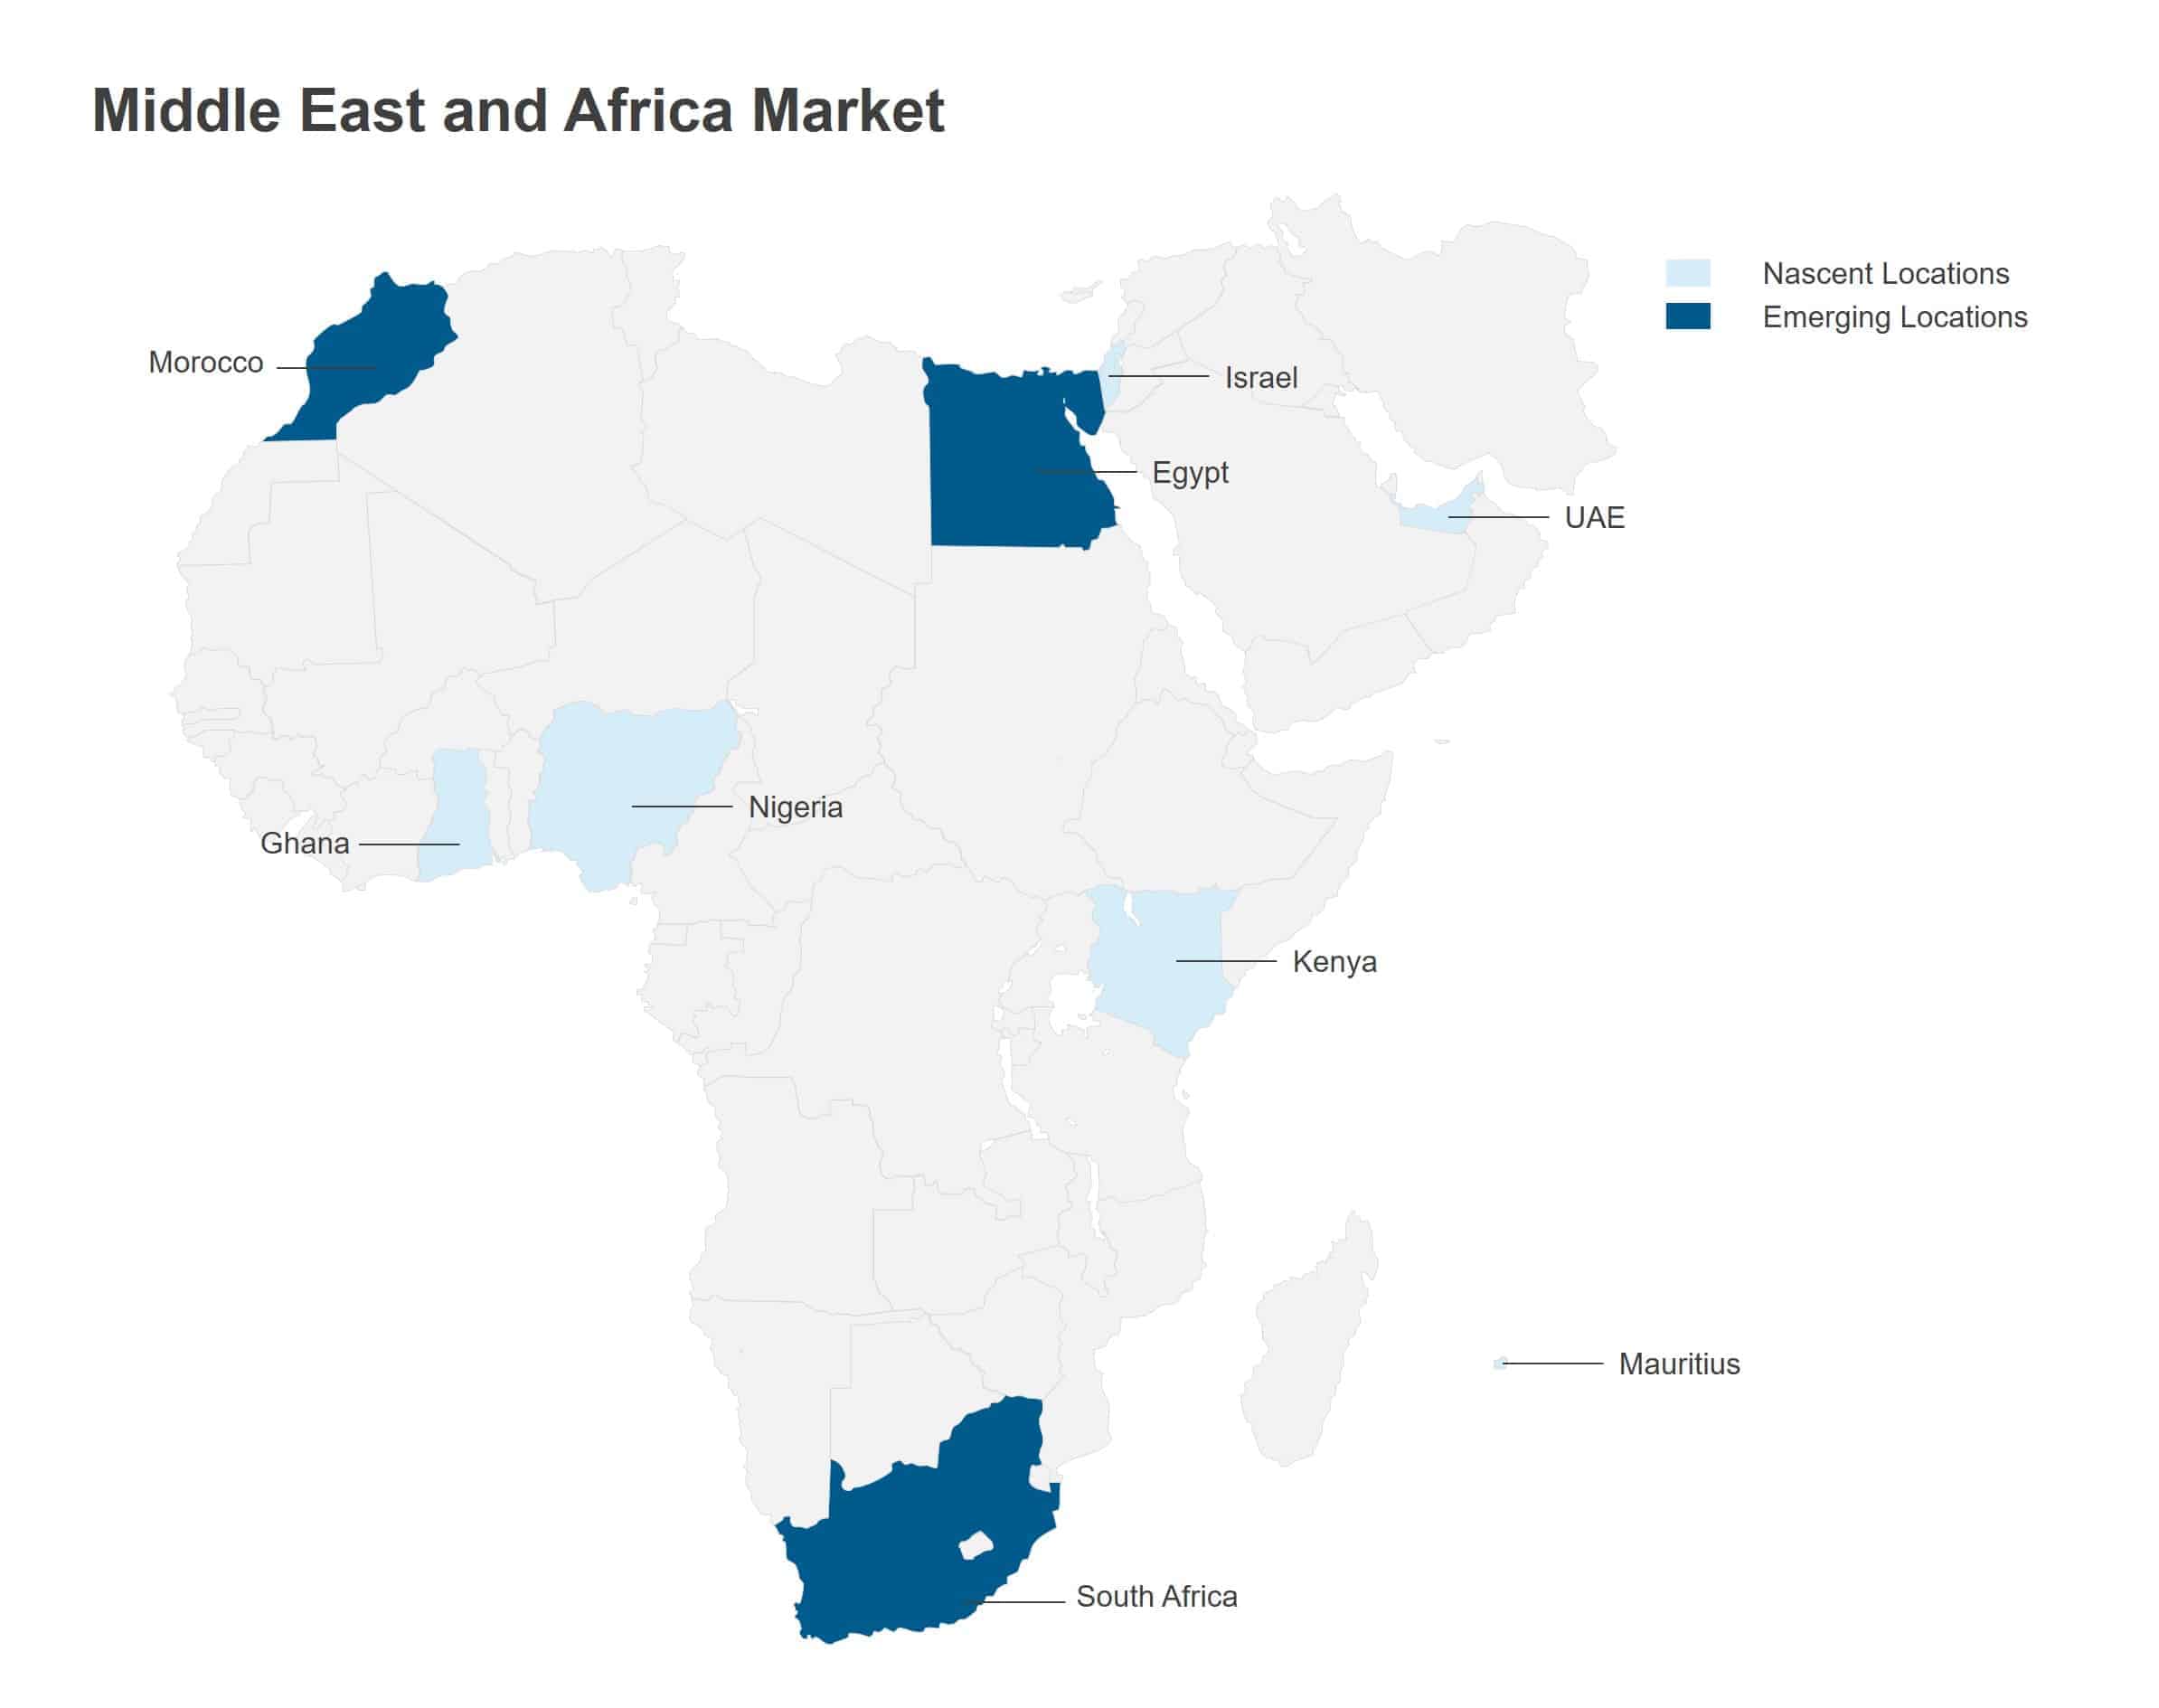
The map below highlights key locations leveraged by global enterprises and service providers for global services delivery. While the emerging locations house 20,000 to 100,000 FTEs across global services, nascent locations employ less than 20,000 FTEs in this space.

BlogImage1


A snapshot view of the top five global services delivery locations in MEA

  • Egypt: Offers the most attractive cost-talent proposition, with strong multilingual skills, especially in English, French, and Arabic languages. However, relatively higher operating environment risk with concerns around high inflation rates and repressive government policies
  • Morocco: Primarily leveraged for French and Arabic language voice-based BPS and IT services. Morocco offers moderate-high competitive intensity and strong government support (especially for the IT-BPS sector through financial, tax, and customs advantages)
  • South Africa: Characterized with large, high-quality talent pools and the highest maturity across functions, South Africa houses multiple organizations delivering voice and non-voice BPS, including complex processes. It has a stable geopolitical environment, well-developed infrastructure, high ease of doing business, strong government incentives for the IT-BPS sector, and limited safety and security concerns
  • Mauritius: It is leveraged for IT (both ADM and infrastructure), non-voice business process services, and R&D services to serve French and Canadian markets. It offers a favorable business environment, with government incentives for the IT-BPS sector, such as tax-free dividends and foreign tax credits
  • Israel: Leveraged for delivery of advanced IT (including IoT, ML, and AI) and R&D services, primarily to support the U.S. and Europe. Israel offers a highly favorable business environment with lower tax rates and conducive government incentives, such as low corporate tax and grants up to 20 percent of the amount of the investment.

For a detailed view of each of these locations, please read our latest Location Spotlight reports. Each report analyzes the individual country’s global sourcing profile, key opportunities, drivers, challenges, talent and skills availability, financial attractiveness, and environment risks.


The Evolution of Contracting Models in Testing Services | Sherpas in Blue Shirts

A large enterprise client recently asked us to confirm whether its belief that the majority of organizations have moved to output- and outcome-based contracting models for testing services was true.

What’s the Reality vs. this Perception?

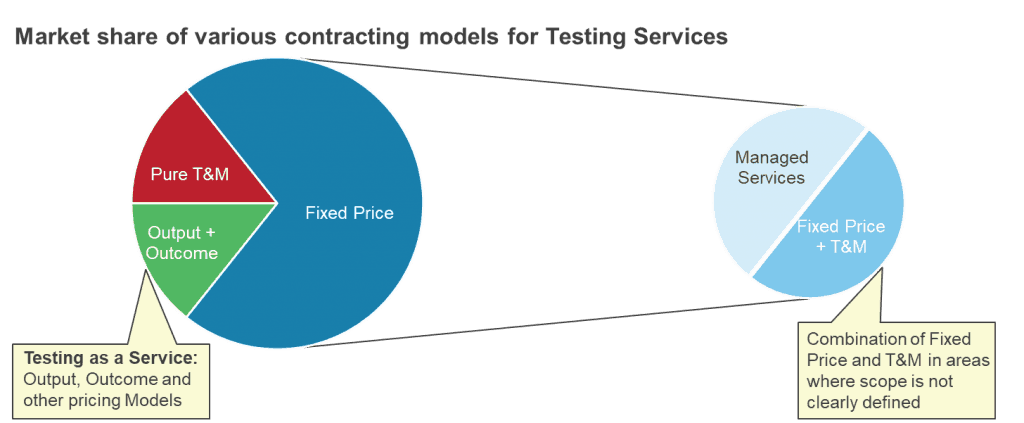
Our analysis of deals in our extensive database over the last 18 months showed that more than 75 percent of buyers are still contracting for testing services on a fixed price basis. Of those, nearly 50 percent are managed services contracts, where performance is linked to key performance indicators (KPIs.) The other 50 percent are a combination of fixed price and Time and Materials (T&M) contracts. In these types of arrangements, the part of the contract where the scope is clear and well defined is fixed price, and the T&M is for the part of the contract where the requirements are unclear, like testing support during the UAT phase, for change requests, etc.

Market Share for Testing Services

About 10-15 percent of the contracts in our set of deals from the last 18 months are purely T&M contracts where clients ask for specific testing resources.

Only the final remaining 10-15 percent of the contracts are based on output- and outcome- based models.

Deeper Look at Output- and Outcome-Based Contracting Models

While the current percentage of output- and outcome-based models is small – the model is  well-suited for engagements where the majority of work is transactional in nature, the client wants pricing clarity and guarantees, and the service provider has no explicit motivation to improve performance beyond service levels.

In fact, we believe that the transition to these as-a-service models is both critical and inevitable for enterprises with engagements matching these criteria – which exceed 15 percent of our database. Why?

  • They ensure enterprises pay for deliverables, not for time
  • They are more closely tied to enterprises’ business activities, as they provide flexibility and visibility into the expected spend
  • They allow enterprises to remain engaged at a strategic level, without worrying about day-to-day responsibilities
  • Since the pricing is delinked from the underlying number of FTEs, process Improvements are driven by the service provider’s motivation to reduce internal costs and improve margins.

At the same time, output- and outcome-based models pose different types of challenges than other types of contracting options, and enterprises must be prepared to address them to achieve success. For example:

  • Due to their fairly complex structure, these contracting models require sophisticated governance and strong due diligence
  • They are not easily benchmarked, because to ensure an apples-to-apples comparison, the benchmarking exercise needs to normalize for all the underlying environment characteristics
  • In multi-vendor environments where there are more dependencies, moving to output- or outcome-based models may increase costs as providers bake the higher risk into their fees.

In our view, most enterprises going down the output- and outcome-based model path will be best served by phasing in the adoption. Doing so will not only help them reduce risks, but also enable them to appropriately update their systems to process output-based transactions, create and put in place sufficient governance mechanisms for the new contracting regime, etc.

Have you embraced an outcome- or output-based contracting model for your testing services? Are you considering it? Please share your experiences with us at [email protected].

CIOs Struggle with Gap in Digital Transformation Expectations and Delivery Capabilities | Sherpas in Blue Shirts

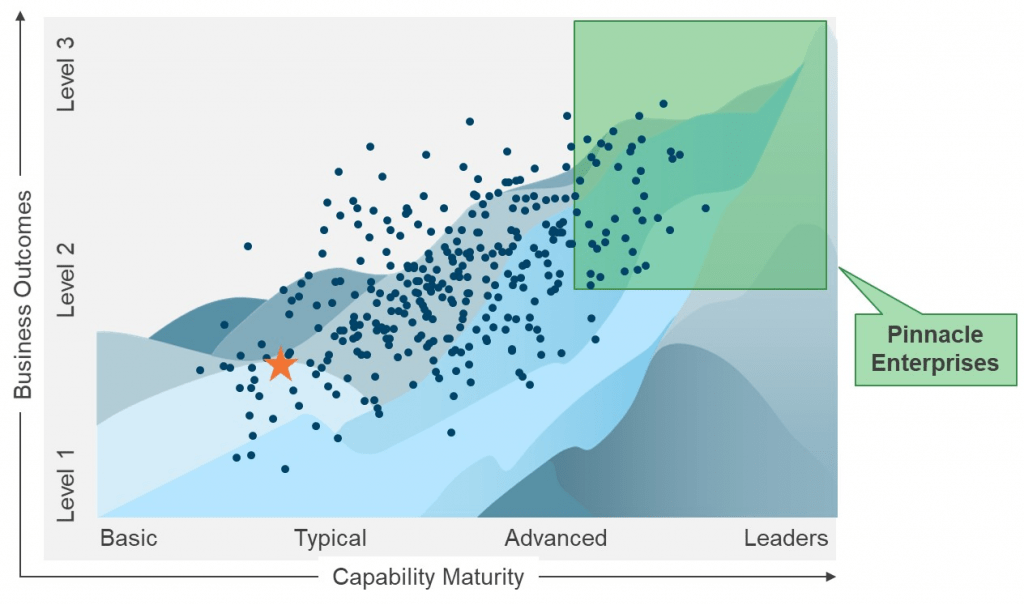
As part of our Pinnacle Model™ methodology and benchmarking, Everest Group recently conducted a study of over 200 companies on their digital transformation readiness. The study found companies’ boards of directors typically believe digital transformation is about technology, and they typically under-estimate the cost and expect results in months, not years. Those expectations are a huge gap away from the reality challenging CIOs and senior leaders leading the digital transformation. CIOs participating in our study revealed their companies were unprepared, under-funded and under-supported as to the tools, investment and commitment required to succeed. In this blog, I’ll share how to effectively communicate to your company the requirements for digital transformation to succeed.

Why Is There a Huge Gap?

The gap between expectations and delivery capabilities is because digital transformation is fundamentally different from companies’ past experiences with transformation. The technologies are disruptive and necessitate changing the organization, talent model, mind-sets, policies, processes and procedures – basically, the entire business model. Those changes are not easy. They don’t come all at once. They’re not completely known at the outset. And they unfold over a multi-year journey.

Peter Drucker advised, “If you want something new, you have to stop doing something old.” But the depth and breadth of necessary changes and the required commitment and investment for digital transformation are complicated to explain. They are hard to understand.

The digital journey requires far more resources, support, commitment and investment than anyone wants to believe. Digital technologies also take far longer to implement than people expect. For instance, in Robotic Process Automation (RPA) technology, a company can put a robot up quickly to create process improvement; but getting significant value involves more than that. Sure, a company can automate a function. But until the executives rethink the process that the robots will perform, they cannot create a meaningful improvement or breakthrough performance.

So, it’s no wonder that the boards don’t understand the extent of what is required to successfully complete a digital transformation journey. They also don’t understand that they need to fund IT transformation at the outset so that IT can successfully support the digital transformation.

As a result, most digital transformation initiatives fail (70%, according to a 2013 McKinsey & Company study. Many participants in Everest Group’s Pinnacle study revealed that, even when they understood the journey, they could not communicate it to their board, could not get funding, could not build support for it, and thus could not drive the change necessary to get it done.

How to Communicate Digital Change Requirements to Your Company

From our Pinnacle Model study, we developed an assessment vehicle (a 30-minute questionnaire) from which your company can compare its digital readiness against the broader population and against the market leaders (the Pinnacle Enterprises™). Together with a four-hour workshop, you’ll have the tools that will allow you to identify gaps, create learnings, understand what things you could do differently to improve your company’s readiness and performance and well as build road maps that allow you to systematically mature your digital readiness.

Learn more about our digital transformation analyses

Executives that have gone through the assessment and workshop tell us it created a great tool for communicating with their board of directors and the rest of the business about the support, resources and investment necessary to allow for successful digital transformation.

It is also a supporting budgeting tool that allows you to demonstrate the value against the cost, build support for the investment required to mature digital readiness and communicate the value that the IT organization will be able to achieve or support by increasing its digital readiness.

There’s a startling fact in the 2013 McKinsey study I cited earlier: Of the “successful” 30% that didn’t report their initiatives as failures, “success” was described as either breaking even or finishing the program but not delivering the anticipated business results. Of course, no company wants to undergo the challenge, effort, and expense of transformation only to break even or remain in the same relative competitive position.

Harvard Professor John P. Kotter’s study of 100 companies that underwent transformation initiatives found more than 50% failed in the first phase (getting organizational commitment and cooperation for the initiative). The Pinnacle assessment, workshop and communication tools are very helpful in addressing these issues.

The Characteristics of Europe’s Digital Banking Leaders | Sherpas in Blue Shirts

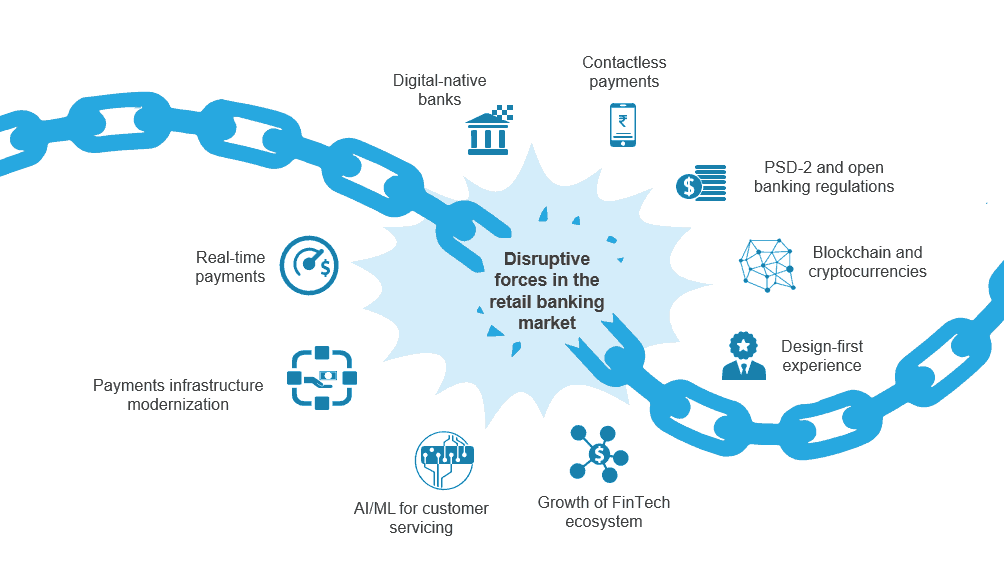
Disruptive forces – open banking regulations, growing FinTech ecosystems, and increasing demand for a seamless customer experience – are forcing banks to make significant investments in digital technologies.

The UK and European banking market is characterized by heightened activity on account of multiple converging factors

To effectively compete, banks must move away from being perceived as physical structures that offer financial services/products to an ambient fabric that connects people and businesses. They must transition from a transactional, product-centric approach to an intelligence-oriented customer-centric model centered around customers’ journeys. Artificial Intelligence (AI), API-enabled open banking architecture, and cloud are fast-becoming the foundations of banks’ IT architecture.

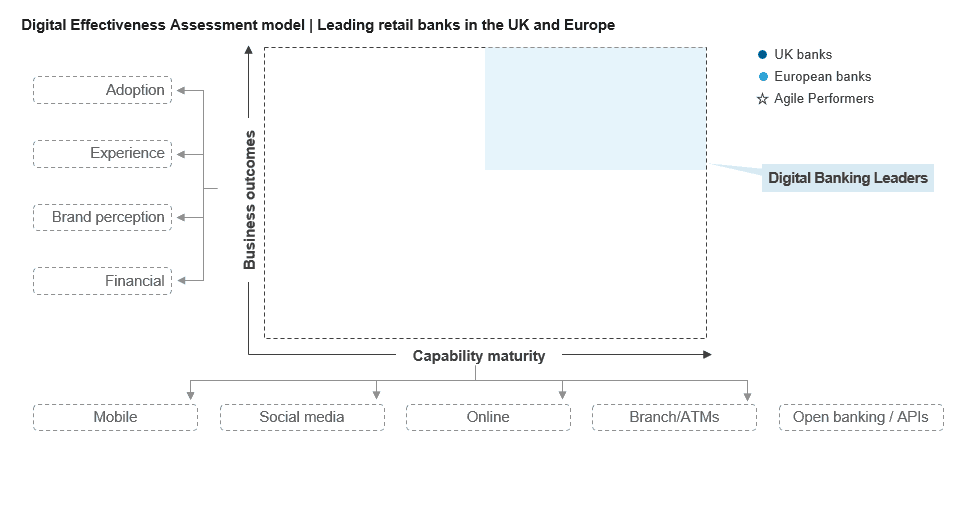
In order to evaluate and measure how organizations are faring in their leverage of digital technologies, Everest Group several years ago developed the Digital Effectiveness Assessment model.

Everest Group Digital Effectiveness Assessment model

On the Capability maturity axis, we measure organizations’ presence on all digital platforms, the quality of their mobile apps and online banking capabilities, their activity on various social media channels, their self-service innovations, and their open banking capabilities. On the Business outcomes axis, we measure their digital prowess using parameters including customers’ digital channel adoption, the customer experience (based on mobile app ratings, website optimization, and engagement), brand perception, and financial performance.

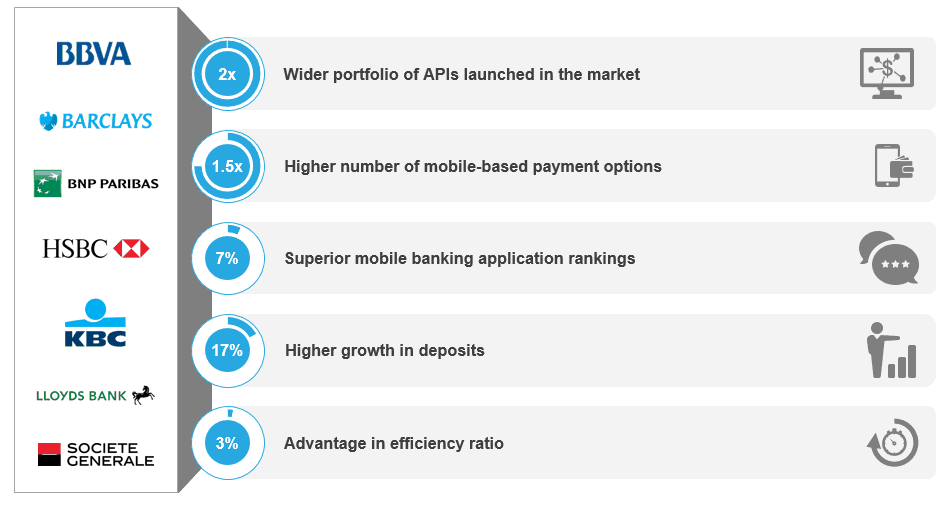
Earlier this year, we used the model to determine the European digital banking leaders. And from a field of the top 20 banks in Europe, we identified seven: Barclays, BBVA, BNP Paribas, HSBC, KBC Group, Lloyds, and Société Générale. These financial institutions have achieved:

  1. Superior financial performance: 17 percent higher growth in deposits, and 3 percent advantage in efficiency ratio in 2017
  2. Superior customer experience: Higher penetration of digital and social channels (e.g., up to 75 percent of BNP Paribas’ retail customers are using mobile app and online banking channels), mobile-based advisory capabilities, and personalized products and services. These leaders’ mobile application ratings are 7 percent higher than the other banks we evaluated.
  3. Stronger customer engagement: A superior user interface (UI), feature-packed mobile apps (e.g., BBVA offers 80 percent of the mobile features evaluated) and online banking platforms, self-service technologies across branch/ATM network (e.g., Barclays offers card-less cash withdrawal, bill payments, and check deposits through ATMs), and meaningful social media content.
  4. Higher business growth: Wider adoption of digital banking channels, superior efficiency ratios, adoption of an open banking ecosystem, and innovative product offerings, particularly through the wider set of APIs they offer.

European Banking Leaders

These leaders have re-designed their customer journey to adapt to external disruptions by:

  1. Calibrating current customer satisfaction: Formulating a unique customer engagement model based on insights gained on each customer’s digital readiness and adoption.
  2. Benchmarking current digital maturity with best-in-class enterprises: Evaluating their digital channel maturity and customer satisfaction scores against best-in-class peers, and then tailoring their digital strategy to bridge the gap in their organization’s vision of the customer experience.
  3. Redesigning the customer experience: Incorporating human-centric design principles to address customers’ stated and unstated requirements and desires.
  4. Optimizing their channel strategy: Developing a comprehensive channel strategy to drive customer adoption and acquisition, and changing the business model to deliver digital experiences.
  5. Innovative product offerings: Offering personal finance management features through digital channels that are intuitive and simple for users. Other services include payments through multiple messaging and social media channels, and intelligent voice-based payment solutions.

To learn more about the characteristics of Europe’s digital banking leaders, and what sets them apart from the others, see our report: Digital Effectiveness in Retail Banking | Focus on Banks in the UK and Europe: Identifying Digital Banking Leaders in the Open Banking Era.

Marketing Services: You Can’t Outsource Creativity…Can You? | Sherpas in Blue Shirts

At the Procurecon Indirect conference in Copenhagen a couple of weeks ago, three senior procurement people from different corporations approached me with their woes about the lack of control and the high levels of procurement indiscipline their marketing departments exhibit. They wanted to know how and if Everest Group could solve the problem of rogue spend with external agencies for marketing services. It’s an interesting and very valid question.

Marketing services is one area in which many enterprises’ Chief Procurement Officers (CPOs) have had neither the evidence nor the mandate to challenge established thinking. Furthermore, unlike IT and non-core business process outsourcing alternatives that have been around for 20 years, outsourcing options for marketing didn’t exist until recently. Now that they do, CPOs are sensing the opportunity, in partnership with Chief Marketing Officers, to transform the way marketing services are delivered.

Benchmarking Can Help, but…

Benchmarking can certainly provide rate-card analysis, SLA review, a breakdown of the cost-stack, and any number of other elements from the contract, to give a view of pricing and equitable contracting. But there are problems:

  1. Marketing services engagements are often part of the long-tail of spend, ad hoc in nature, sometimes not subject to a formal contract, and often worth not much individually. Benchmarking these could cost a CPO several-fold more than would likely be saved
  2. If a contract did exist, benchmarking would drive the discussion between a procurement team wanting to understand whether marketing services suppliers are delivering value and a marketing department wanting to defend the status quo. Typically, however, benchmarking informs the commercial negotiation between client and supplier
  3. The nature of marketing services engagements are sometimes niche and specialist, based on knowledge of a vertical or channel acquired over time. Providing meaningful points of comparison is likely to be difficult
  4. Buyers will doubtless maintain that it is impossible to benchmark creativity.

But, as one of my Procurecon conversations suggested, the issues for CPOs aren’t high levels of spend or a desire to be in control of every spending decision. Rather, they’re concerned about fragmented spend and lack of overall visibility.

5 Steps CPOs Can Take

They can begin by promoting the procurement function as an exemplar of best practice by pointing to examples in other spend categories of how procurement has driven cost savings, improved quality, or stimulated innovation. Doing so establishes CPOs’ leadership credentials.

Next, they can introduce some level of technology that will deliver at least visibility into spend. Several speakers at the conference cited the need for the procurement process to generate data to increase efficiency. Many CPOs without a mandate for category management seem reluctant to push for integrated procure-to-pay or source-to-contract systems. But less invasive approaches, such as customized applications in Salesforce, could still generate useful information about spend categories, transaction volumes, and whether suppliers are being contracted by separate groups within an enterprise.

Third, they can consider portfolio rationalisation, against these rationales:

  1. unravelling large numbers of small, often informal arrangements is hard, but the disconnected procurement of “specialized” or creative skills by separate parts of the business can produce a rate-card premium of up to 25 percent
  2. buyers may have contracted long-term rates for specialized skills; in this age of rapid obsolescence, the skills may have become commonplace, but the long-term contracts continue to charge contracted premiums
  3. a specific resource requirement may indeed be specialised for a provider with low capability in a particular area, but may fall into another provider’s delivery sweet spot; in our experience, transitioning such skills to a best-fit provider can save between 1 percent and 3 percent of contracting costs.

Next, they can investigate alternatives. Arguably, marketing services and creative agency spend are still immature enough to offer the opportunity to arbitrage. And providers with capability are rapidly emerging. Accenture has acquired over 20 agencies since 2010. Onsite digital design agencies such as NuFu, Oliver, and Spark44 have a growing impact. Every major service provider – Atos, Cognizant, Sutherland Global, Wipro, etc. – is investing in or acquiring digital agencies, and these investments will allow enterprises to consider accessing marketing services alongside a suite of outsourced IT or business process services.

Finally, they can benchmark the status quo with an alternative. Can a sourced solution give the enterprise not only a cost advantage but also faster delivery, access to global talent, measurable outcomes, and real transparency?

So, CPOs, there’s little reason to ask yourself “how do I do it?” Instead, the real question is, “why wait?”

You can find out how Everest Group helps enterprises optimise global procurement operations here. We also help enterprises rationalise complex portfolios of external suppliers.

WaterSprint or AgileFall: Implementing Packaged Apps in Contemporary Times | Sherpas in Blue Shirts

During a recent next-generation packaged application benchmarking project for one of our Tier 1 clients, one point jumped out at us: service providers and product vendors have started moving away from the traditional waterfall approach to an adaptive hybrid agile-waterfall approach while solutioning for packaged application deployments.

Is an Agile-Led Methodology Needed?

You’re probably wondering if an agile-led methodology is necessary, since packaged applications have inbuilt configurations that are aligned to industry best practices. The resounding answer is yes, as packaged apps projects have been victims of scope creep, cost overruns, missed deadlines, objective mismatches, and a host of other issues. A good share of these failures can be attributed to the customization requirements that were built using a traditional implementation approach, which encouraged a siloed and non-continuous way of working.

How is the Hybrid Approach Effective?

The effectiveness of the hybrid approach can be easily gauged through a mix of waterfall and agile-based SLAs and KPIs. We are seeing that using the hybrid waterfall-agile methodology significantly improves traditional packaged apps implementation project SLAs such as defect leakage, defect density, and schedule and cost adherence. And agile KPIs such as velocity rate, work-focus factor, and percent of story-point accuracy help keep track of team productivity, and enable the team to track deviations from standard configurations.

One major adopter of the hybrid approach is SAP, which has refurbished its implementation framework with the introduction of its agile-based Activate methodology for the SAP S/4 HANA suite. While SAP has retained the strong elements of the traditional Accelerated SAP (ASAP) waterfall methodology, it has changed its approach from a template-led long duration blueprinting exercise to a fit-gap analysis for processes configured on a cloud-based solution. Additionally, it no longer runs the realization phase in a linear fashion, wherein testing is performed only after complete configuration or customization is done. Instead, testing resources are onboarded as soon as the sprint starts, and implementation effectiveness is gauged right from the word “go.”

Many service providers and product vendors are also following this same approach in some form and fashion, particularly in the realization phase.

What’s the Value of Shifting to a Hybrid Agile Approach?

It helps enterprises streamline their journey to becoming a truly agile organization, and enables a better end-user experience, as improved SLAs underscore better service delivery. And it helps service providers enhance their brand reputation, capture more business, and shed the tag of being old school and monolithic in their implementation approach.

If you are interested in learning more about the impact of the hybrid waterfall methodology on project timelines, average daily rate, overall TCV, contractual SLAs, and risk alleviation mechanisms, please feel free to reach out to me at [email protected]. You can also visit our Benchmarking page.

Three Characteristics of Digital Pinnacle Enterprises | Sherpas in Blue Shirts

Earlier this week, we announced our new Pinnacle ModelTM analyses, which provide deep research on the capabilities top-performing companies have leveraged, and the journey they’ve taken, to become the crème de la crème.

Now, to sate your bated breath, here are the results of our first analysis on organizations’ adoption of digital strategies and what sets Digital Pinnacle EnterprisesTM apart from their peers.

Many people equate the word “digital” with “technology.” In the consumer world, they might think about the cool new mobile phone they just bought, the home entertainment streaming device that’s on their wish list, or how to carve out the time before the end of the year to turn their abode into a smart home. In a business context, cloud computing, robotics for their factory or their business processes, or a new customer interaction application may come to mind.

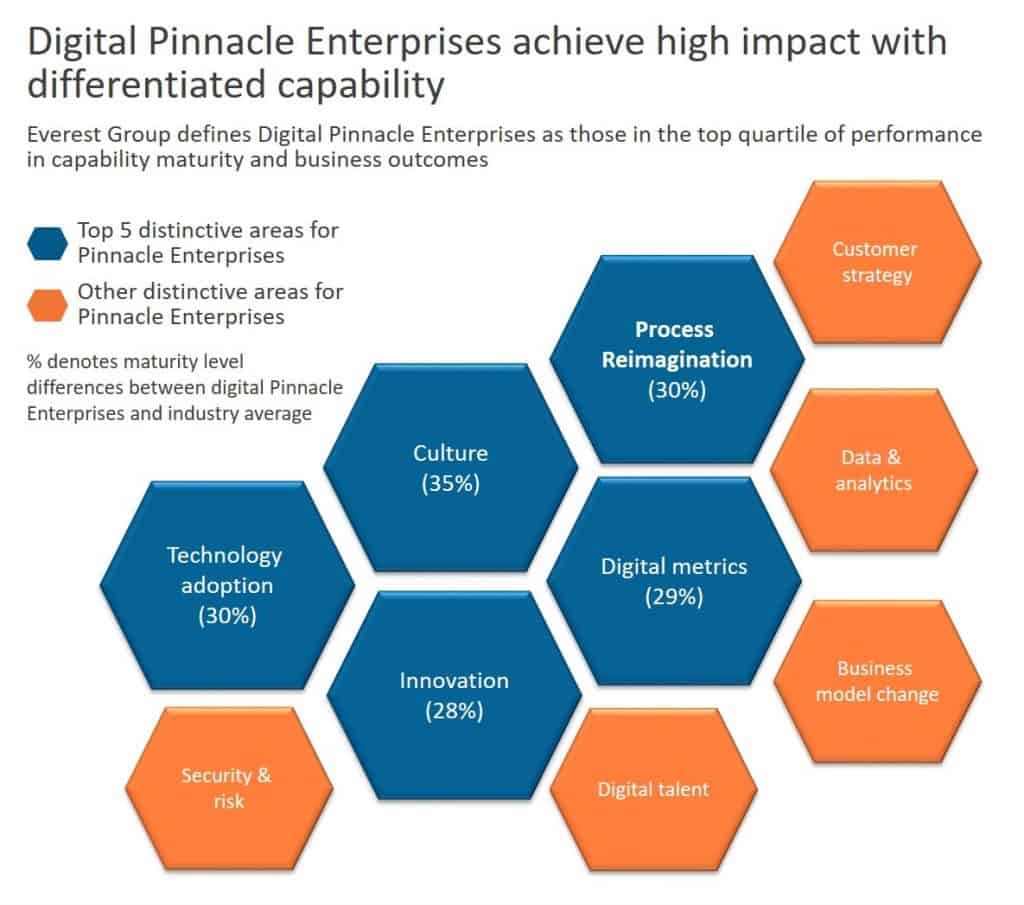
But one of the key findings from this analysis is that technology in and of itself isn’t Digital Pinnacle Enterprises’ biggest differentiator. Rather, Digital Pinnacle Enterprises stand out for making a strategic impact through their digital transformation efforts. Their track record for accomplishing business outcomes such as disrupting the industry, improving customer experiences, increasing market share, and launching innovative products and services, were significantly better than their peers.

And the value their digital transformation projects deliver are measurable and quantifiable. For example, as I mentioned in my previous blog, one banking client reduced its customer onboarding process from 16 days to 9 minutes. A retailer reduced its SKU management efforts by 80 percent, while simultaneously improving accuracy. And a software company saw improved invoice processing that reduced direct FTEs by 67 percent, and decreased customer calls to the help desk by 20 percent.

Digital pinnacle enterprise characteristics
Our analysis showed three key capabilities that Digital Pinnacle Enterprises have leveraged to realize these types of outcomes.

  1. Culture: Digital Pinnacle Enterprises have invested extensively in adopting and embracing an innovation-focused culture. They have partnered in startups to source new innovation across their product and services portfolio, and established a centralized team responsible for sourcing ideas from vendors, startups, employees, and customers. Their peers did not.
  2. Technology adoption practices: Digital Pinnacle Enterprises have built management practices around the evaluation of new innovative technologies such as big data analytics, cloud, DevOps, cognitive computing, and artificial intelligence. Their peers did not.
  3. Process Re-imagination: Digital Pinnacle Enterprises have defined current and future states of key internal processes, and worked with their process owners to identify waste. And…you guessed it. Their peers did not.

Of course, technology is a required core of any organization’s digital initiative. But those that have reached the pinnacle have focused on the key capabilities required to achieve real, measurable transformation.

I hope this has given you some food for thought on how to elevate your company to a Digital Pinnacle Enterprise. I also hope you’re hungry for more, because over the next few months and quarters we’ll be discussing very specific disruptive digital technologies and other market hot topics in additional Pinnacle Model Analyses. Bring your appetite!

Global Services’ Pinnacle Enterprises – How Did They Become the Best of the Best? | Sherpas in Blue Shirts

Companies like Amazon, Apple, Disney, GE, Starbucks, and Tesla are considered by most as the best of the best in their industries. The ways they became the “coolest kids” are the stuff of business school case studies, countless news articles, and lunch room / board room discussions around the world.

Of course, there are many less iconic enterprises that have unlocked the performance excellence code. For example, a leading global bank recently reduced its customer onboarding time from 16 days to 9 minutes. Yes, you read that right…from 7,680 minutes to 9 minutes, assuming an 8-hour business day. Wouldn’t you love to know how it achieved that mind-numbingly positive business outcome, and how you could extrapolate what it did into your organization?

Therein lies the rub. You might read a case study that explains how it implemented an enterprise-wide automation platform that helped it transform operations. Seeing that automation was the core of its solution, you might access benchmarking studies to better understand best practices and how your business compares. Broadening your research, you might also access high-volume surveys that gather opinions and intentions on automation.

But none of these tools reflect actual performance or the capabilities this organization – or others achieving such remarkable results – has brought to bear to become the best of the best. They lack the insight you need to accelerate your impact in measurable ways.

We believe that to understand a topic, you need to directly compare and correlate business outcomes with the capabilities required to achieve those results. Our new Pinnacle ModelTM anayses do just that.

Pinnacle Model for Enterprises

The analyses paint a picture of the capabilities the “cool,” “it” companies – what we call Pinnacle EnterprisesTM – have leveraged and the journey they’ve gone through to realize superior business outcomes. They’ll arm you with the self-discovery of comparison that will help you design a change roadmap to be competitive today – and tomorrow.

Recently. we released a complimentary assessment of our first Pinnacle Model analysis results, which are for Pinnacle Enterprises adopting digital strategies. Spoiler alert: the capability that distinguishes the Pinnacle Enterprises from their peers isn’t their actual technology deployment.

And as 2018 approaches, we’ll use the Pinnacle Model to tackle other hot topics.

PS: For our service provider friends: When we talk about enterprises understanding their unique paths to accelerating their impact, I challenge you to think about how your differentiated capabilities can help accelerate the journeys of your clients and prospects.

How can we engage?

Please let us know how we can help you on your journey.

Contact Us

"*" indicates required fields

Please review our Privacy Notice and check the box below to consent to the use of Personal Data that you provide.